
 - Blog
| Conference: | BSky |
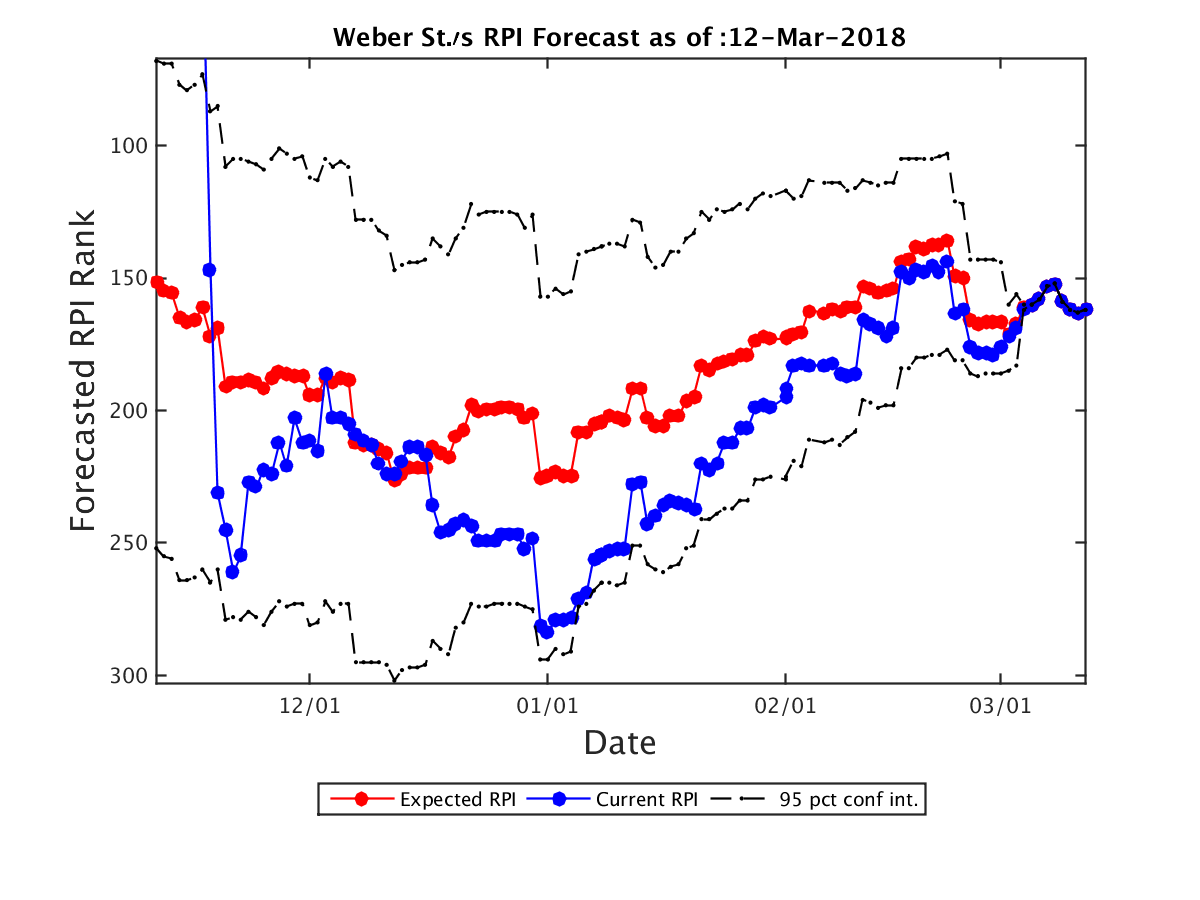
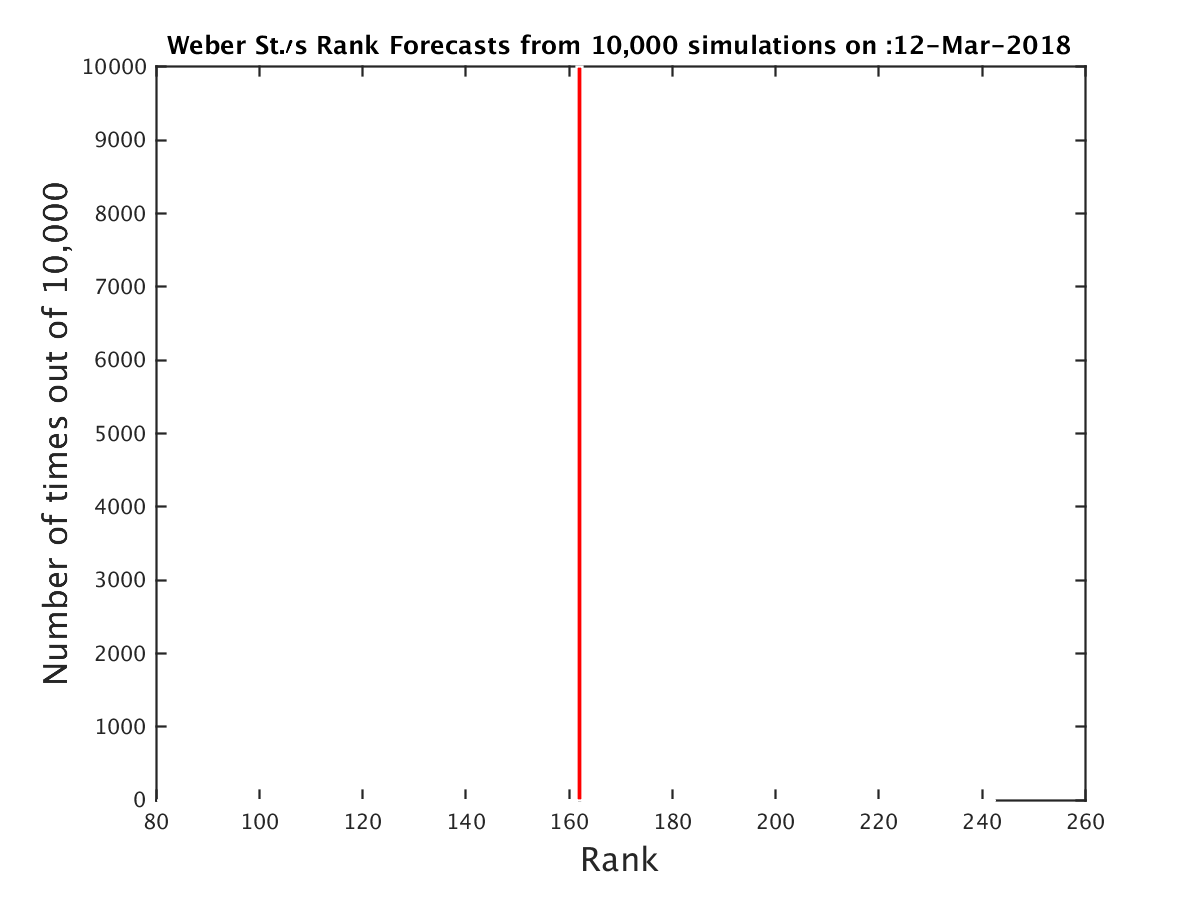
| Expected RPI: | 162.0 |
| Current RPI: | 162 |
| Expected SOS: | 237 |
| Current SOS: | 237 |
| Current Record: | 17-11 |
| Expected Record: | 17-11 |
| Current Conf Record: | 13-6 |
| Expected Conf Record: | 13-6 |
| Expected Record vs RPI 1-25: | 0-0 |
| Expected Record vs RPI 26-50: | 0-0 |
| Expected Record vs RPI 51-100: | 0-3 |
| Expected Record vs RPI 101-200: | 5-6 |
| Expected Record vs RPI 200+: | 12-2 |
| Current OOC Record: | 4-5 |
| Expected OOC Record: | 4-5 |
| Expected OOC RPI: | 220 |
| Expected OOC SOS: | 164 |
| Final Record | Expected RPI | Probability |
|---|---|---|
| 17-11 | 162.0 | 100.00% |
| Date | Opponent (Expected RPI) | Conf | Location | Score | Outcome | Prob(W) | Spread |
|---|---|---|---|---|---|---|---|
| 11-10 | Utah St. (152.0) | MWC | H | 65-59 | W | 100% | 0.0 |
| 11-17 | Iona (107.0) | MAAC | N | 72-80 | L | 0% | 0.0 |
| 11-18 | James Madison (272.0) | CAA | N | 73-65 | W | 100% | 0.0 |
| 11-19 | Bradley (105.0) | MVC | N | 64-70 | L | 0% | 0.0 |
| 11-30 | Fresno St. (103.0) | MWC | A | 83-71 | L | 0% | 0.0 |
| 12-6 | Utah Valley (83.0) | WAC | A | 83-56 | L | 0% | 0.0 |
| 12-9 | BYU (67.0) | WCC | N | 74-68 | L | 0% | 0.0 |
| 12-16 | Arkansas Pine Bluff (307.0) | SWAC | H | 96-74 | W | 100% | 0.0 |
| 12-19 | Pepperdine (317.0) | WCC | H | 72-67 | W | 100% | 0.0 |
| 12-30 | Idaho St. (268.0) | BSky | H | 60-62 | L | 0% | 0.0 |
| 1-4 | Northern Arizona (310.0) | BSky | H | 95-55 | W | 100% | 0.0 |
| 1-6 | Southern Utah (252.0) | BSky | H | 92-76 | W | 100% | 0.0 |
| 1-11 | Northern Colorado (110.0) | BSky | A | 74-78 | W | 100% | 0.0 |
| 1-13 | North Dakota (221.0) | BSky | A | 89-79 | L | 0% | 0.0 |
| 1-18 | Sacramento St. (309.0) | BSky | H | 80-64 | W | 100% | 0.0 |
| 1-20 | Portland St. (170.0) | BSky | H | 84-79 | W | 100% | 0.0 |
| 1-27 | Idaho St. (268.0) | BSky | A | 70-77 | W | 100% | 0.0 |
| 2-1 | Southern Utah (252.0) | BSky | A | 80-90 | W | 100% | 0.0 |
| 2-3 | Northern Arizona (310.0) | BSky | A | 55-87 | W | 100% | 0.0 |
| 2-8 | North Dakota (221.0) | BSky | H | 84-76 | W | 100% | 0.0 |
| 2-10 | Northern Colorado (110.0) | BSky | H | 71-66 | W | 100% | 0.0 |
| 2-15 | Portland St. (170.0) | BSky | A | 86-95 | W | 100% | 0.0 |
| 2-17 | Sacramento St. (309.0) | BSky | A | 73-83 | W | 100% | 0.0 |
| 2-22 | Eastern Washington (122.0) | BSky | H | 70-75 | L | 0% | 0.0 |
| 2-24 | Idaho (133.0) | BSky | H | 62-68 | L | 0% | 0.0 |
| 3-1 | Montana (76.0) | BSky | A | 75-57 | L | 0% | 0.0 |
| 3-3 | Montana St. (283.0) | BSky | A | 92-95 | W | 100% | 0.0 |
| 3-8 | Northern Colorado (110.0) | BSky | N | 55-80 | L | 0% | 0.0 |
| Team | Conf | Curr Wgt | Fut Wgt | Curr W/L | Exp W/L | Curr Impact | Exp Impact |
|---|---|---|---|---|---|---|---|
| Weber St. | BSky | 26.35 | 26.35 | 60.45 | 60.45 | 5.51 | 5.51 |
| Northern Colorado | BSky | 6.19 | 6.19 | 64.29 | 64.29 | 1.77 | 1.77 |
| Idaho St. | BSky | 4.57 | 4.57 | 42.31 | 42.31 | -0.70 | -0.70 |
| Southern Utah | BSky | 4.47 | 4.47 | 39.29 | 39.29 | -0.96 | -0.96 |
| North Dakota | BSky | 4.46 | 4.46 | 32.14 | 32.14 | -1.59 | -1.59 |
| Portland St. | BSky | 4.43 | 4.43 | 60.71 | 60.71 | 0.95 | 0.95 |
| Northern Arizona | BSky | 4.40 | 4.40 | 14.29 | 14.29 | -3.15 | -3.15 |
| Sacramento St. | BSky | 4.38 | 4.38 | 17.86 | 17.86 | -2.81 | -2.81 |
| Montana | BSky | 2.91 | 2.91 | 76.67 | 76.67 | 1.55 | 1.55 |
| Eastern Washington | BSky | 2.89 | 2.89 | 54.84 | 54.84 | 0.28 | 0.28 |
| Montana St. | BSky | 2.85 | 2.85 | 37.93 | 37.93 | -0.69 | -0.69 |
| Idaho | BSky | 2.79 | 2.79 | 67.86 | 67.86 | 1.00 | 1.00 |
| Pepperdine | WCC | 1.98 | 1.98 | 16.67 | 16.67 | -1.32 | -1.32 |
| BYU | WCC | 1.96 | 1.96 | 69.70 | 69.70 | 0.77 | 0.77 |
| Utah St. | MWC | 1.96 | 1.96 | 50.00 | 50.00 | 0.00 | 0.00 |
| Utah Valley | WAC | 1.94 | 1.94 | 64.29 | 64.29 | 0.55 | 0.55 |
| Fresno St. | MWC | 1.90 | 1.90 | 62.07 | 62.07 | 0.46 | 0.46 |
| Arkansas Pine Bluff | SWAC | 1.88 | 1.88 | 41.18 | 41.18 | -0.33 | -0.33 |
| Bradley | MVC | 1.79 | 1.79 | 58.06 | 58.06 | 0.29 | 0.29 |
| Iona | MAAC | 1.79 | 1.79 | 59.38 | 59.38 | 0.33 | 0.33 |
| James Madison | CAA | 1.79 | 1.79 | 30.00 | 30.00 | -0.71 | -0.71 |
| Santa Clara | WCC | 0.31 | 0.31 | 34.48 | 34.48 | -0.10 | -0.10 |
| UNLV | MWC | 0.29 | 0.29 | 60.61 | 60.61 | 0.06 | 0.06 |
| Cal St. Northridge | BW | 0.27 | 0.27 | 14.29 | 14.29 | -0.20 | -0.20 |
| UC Davis | BW | 0.26 | 0.26 | 66.67 | 66.67 | 0.09 | 0.09 |
| Cal St. Bakersfield | WAC | 0.24 | 0.24 | 33.33 | 33.33 | -0.08 | -0.08 |
| Boise St. | MWC | 0.23 | 0.23 | 73.33 | 73.33 | 0.11 | 0.11 |
| Portland | WCC | 0.23 | 0.23 | 24.14 | 24.14 | -0.12 | -0.12 |
| Wyoming | MWC | 0.23 | 0.23 | 59.38 | 59.38 | 0.04 | 0.04 |
| Saint Mary's | WCC | 0.22 | 0.22 | 84.85 | 84.85 | 0.16 | 0.16 |
| Gonzaga | WCC | 0.22 | 0.22 | 88.24 | 88.24 | 0.17 | 0.17 |
| San Jose St. | MWC | 0.21 | 0.21 | 10.34 | 10.34 | -0.16 | -0.16 |
| San Diego St. | MWC | 0.20 | 0.20 | 67.74 | 67.74 | 0.07 | 0.07 |
| San Francisco | WCC | 0.20 | 0.20 | 53.12 | 53.12 | 0.01 | 0.01 |
| San Diego | WCC | 0.20 | 0.20 | 56.67 | 56.67 | 0.03 | 0.03 |
| Youngstown St. | Horz | 0.18 | 0.18 | 20.00 | 20.00 | -0.11 | -0.11 |
| South Dakota | Sum | 0.17 | 0.17 | 73.33 | 73.33 | 0.08 | 0.08 |
| Colorado St. | MWC | 0.17 | 0.17 | 32.26 | 32.26 | -0.06 | -0.06 |
| Loyola Marymount | WCC | 0.17 | 0.17 | 33.33 | 33.33 | -0.06 | -0.06 |
| Seattle | WAC | 0.15 | 0.15 | 56.67 | 56.67 | 0.02 | 0.02 |
| UC Riverside | BW | 0.15 | 0.15 | 24.14 | 24.14 | -0.08 | -0.08 |
| UC Santa Barbara | BW | 0.15 | 0.15 | 70.00 | 70.00 | 0.06 | 0.06 |
| UC Irvine | BW | 0.15 | 0.15 | 48.48 | 48.48 | -0.00 | -0.00 |
| Nevada | MWC | 0.14 | 0.14 | 79.41 | 79.41 | 0.08 | 0.08 |
| New Mexico | MWC | 0.14 | 0.14 | 54.55 | 54.55 | 0.01 | 0.01 |
| Air Force | MWC | 0.14 | 0.14 | 34.48 | 34.48 | -0.04 | -0.04 |
| Pacific | WCC | 0.14 | 0.14 | 41.94 | 41.94 | -0.02 | -0.02 |
| Mississippi Valley St. | SWAC | 0.13 | 0.13 | 12.50 | 12.50 | -0.10 | -0.10 |
| Arizona St. | P12 | 0.12 | 0.12 | 64.52 | 64.52 | 0.04 | 0.04 |
| Cal St. Fullerton | BW | 0.12 | 0.12 | 62.07 | 62.07 | 0.03 | 0.03 |
| North Dakota St. | Sum | 0.12 | 0.12 | 41.38 | 41.38 | -0.02 | -0.02 |
| Long Beach St. | BW | 0.12 | 0.12 | 41.94 | 41.94 | -0.02 | -0.02 |
| Stanford | P12 | 0.12 | 0.12 | 54.55 | 54.55 | 0.01 | 0.01 |
| Denver | Sum | 0.12 | 0.12 | 46.43 | 46.43 | -0.01 | -0.01 |
| Hawaii | BW | 0.12 | 0.12 | 53.57 | 53.57 | 0.01 | 0.01 |
| Texas Southern | SWAC | 0.10 | 0.10 | 44.12 | 44.12 | -0.01 | -0.01 |
| Washington St. | P12 | 0.09 | 0.09 | 38.71 | 38.71 | -0.02 | -0.02 |
| Grand Canyon | WAC | 0.09 | 0.09 | 65.62 | 65.62 | 0.03 | 0.03 |
| Duke | ACC | 0.09 | 0.09 | 78.79 | 78.79 | 0.05 | 0.05 |
| Chicago St. | WAC | 0.09 | 0.09 | 3.33 | 3.33 | -0.08 | -0.08 |
| Cal Poly | BW | 0.09 | 0.09 | 24.14 | 24.14 | -0.05 | -0.05 |
| Central Michigan | MAC | 0.09 | 0.09 | 53.33 | 53.33 | 0.01 | 0.01 |
| Oregon | P12 | 0.09 | 0.09 | 64.71 | 64.71 | 0.03 | 0.03 |
| UTSA | CUSA | 0.09 | 0.09 | 53.33 | 53.33 | 0.01 | 0.01 |
| Colorado | P12 | 0.09 | 0.09 | 53.12 | 53.12 | 0.01 | 0.01 |
| Drexel | CAA | 0.09 | 0.09 | 37.50 | 37.50 | -0.02 | -0.02 |
| Southern Miss | CUSA | 0.09 | 0.09 | 40.00 | 40.00 | -0.02 | -0.02 |
| Evansville | MVC | 0.09 | 0.09 | 50.00 | 50.00 | 0.00 | 0.00 |
| Delaware | CAA | 0.09 | 0.09 | 38.71 | 38.71 | -0.02 | -0.02 |
| Oregon St. | P12 | 0.09 | 0.09 | 50.00 | 50.00 | 0.00 | 0.00 |
| Troy | SB | 0.09 | 0.09 | 45.16 | 45.16 | -0.01 | -0.01 |
| Northeastern | CAA | 0.08 | 0.08 | 68.75 | 68.75 | 0.03 | 0.03 |
| Drake | MVC | 0.08 | 0.08 | 48.39 | 48.39 | -0.00 | -0.00 |
| Loyola Chicago | MVC | 0.08 | 0.08 | 84.38 | 84.38 | 0.06 | 0.06 |
| Valparaiso | MVC | 0.08 | 0.08 | 43.33 | 43.33 | -0.01 | -0.01 |
| Illinois St. | MVC | 0.08 | 0.08 | 53.12 | 53.12 | 0.01 | 0.01 |
| Utah | P12 | 0.08 | 0.08 | 63.33 | 63.33 | 0.02 | 0.02 |
| Fairfield | MAAC | 0.08 | 0.08 | 51.52 | 51.52 | 0.00 | 0.00 |
| Manhattan | MAAC | 0.08 | 0.08 | 45.16 | 45.16 | -0.01 | -0.01 |
| Saint Peter's | MAAC | 0.08 | 0.08 | 43.75 | 43.75 | -0.01 | -0.01 |
| Niagara | MAAC | 0.08 | 0.08 | 59.38 | 59.38 | 0.02 | 0.02 |
| Canisius | MAAC | 0.08 | 0.08 | 65.62 | 65.62 | 0.02 | 0.02 |
| Southern | SWAC | 0.08 | 0.08 | 41.94 | 41.94 | -0.01 | -0.01 |
| New Mexico St. | WAC | 0.06 | 0.06 | 83.33 | 83.33 | 0.04 | 0.04 |
| Sam Houston St. | Slnd | 0.06 | 0.06 | 51.72 | 51.72 | 0.00 | 0.00 |
| UMKC | WAC | 0.06 | 0.06 | 27.59 | 27.59 | -0.03 | -0.03 |
| UT Rio Grande Valley | WAC | 0.06 | 0.06 | 43.33 | 43.33 | -0.01 | -0.01 |
| Arizona | P12 | 0.06 | 0.06 | 79.41 | 79.41 | 0.04 | 0.04 |
| Butler | BE | 0.06 | 0.06 | 60.61 | 60.61 | 0.01 | 0.01 |
| California | P12 | 0.06 | 0.06 | 25.81 | 25.81 | -0.03 | -0.03 |
| Creighton | BE | 0.06 | 0.06 | 64.52 | 64.52 | 0.02 | 0.02 |
| Hampton | MEAC | 0.06 | 0.06 | 51.61 | 51.61 | 0.00 | 0.00 |
| Iowa | B10 | 0.06 | 0.06 | 42.42 | 42.42 | -0.01 | -0.01 |
| Jacksonville | ASun | 0.06 | 0.06 | 37.93 | 37.93 | -0.01 | -0.01 |
| Kansas St. | B12 | 0.06 | 0.06 | 66.67 | 66.67 | 0.02 | 0.02 |
| Michigan St. | B10 | 0.06 | 0.06 | 87.88 | 87.88 | 0.05 | 0.05 |
| Nebraska | B10 | 0.06 | 0.06 | 68.75 | 68.75 | 0.02 | 0.02 |
| Nebraska Omaha | Sum | 0.06 | 0.06 | 24.14 | 24.14 | -0.03 | -0.03 |
| Saint Joseph's | A10 | 0.06 | 0.06 | 50.00 | 50.00 | 0.00 | 0.00 |
| South Dakota St. | Sum | 0.06 | 0.06 | 80.00 | 80.00 | 0.04 | 0.04 |
| South Florida | Amer | 0.06 | 0.06 | 31.25 | 31.25 | -0.02 | -0.02 |
| George Mason | A10 | 0.06 | 0.06 | 48.48 | 48.48 | -0.00 | -0.00 |
| Southeast Missouri St. | OVC | 0.06 | 0.06 | 41.38 | 41.38 | -0.01 | -0.01 |
| College of Charleston | CAA | 0.06 | 0.06 | 77.42 | 77.42 | 0.03 | 0.03 |
| Elon | CAA | 0.06 | 0.06 | 40.00 | 40.00 | -0.01 | -0.01 |
| Hofstra | CAA | 0.06 | 0.06 | 60.00 | 60.00 | 0.01 | 0.01 |
| Oral Roberts | Sum | 0.06 | 0.06 | 28.57 | 28.57 | -0.02 | -0.02 |
| Towson | CAA | 0.06 | 0.06 | 53.33 | 53.33 | 0.00 | 0.00 |
| UNC Wilmington | CAA | 0.06 | 0.06 | 30.00 | 30.00 | -0.02 | -0.02 |
| William & Mary | CAA | 0.06 | 0.06 | 58.62 | 58.62 | 0.01 | 0.01 |
| Georgia St. | SB | 0.06 | 0.06 | 68.75 | 68.75 | 0.02 | 0.02 |
| Washington | P12 | 0.06 | 0.06 | 62.50 | 62.50 | 0.01 | 0.01 |
| Northern Kentucky | Horz | 0.06 | 0.06 | 68.97 | 68.97 | 0.02 | 0.02 |
| Indiana St. | MVC | 0.06 | 0.06 | 37.93 | 37.93 | -0.01 | -0.01 |
| Missouri St. | MVC | 0.06 | 0.06 | 53.12 | 53.12 | 0.00 | 0.00 |
| Northern Iowa | MVC | 0.06 | 0.06 | 46.67 | 46.67 | -0.00 | -0.00 |
| Southern Illinois | MVC | 0.06 | 0.06 | 59.38 | 59.38 | 0.01 | 0.01 |
| Monmouth | MAAC | 0.05 | 0.05 | 35.48 | 35.48 | -0.02 | -0.02 |
| Rider | MAAC | 0.05 | 0.05 | 70.97 | 70.97 | 0.02 | 0.02 |
| Siena | MAAC | 0.05 | 0.05 | 25.00 | 25.00 | -0.03 | -0.03 |
| Alabama A&M | SWAC | 0.05 | 0.05 | 9.68 | 9.68 | -0.04 | -0.04 |
| Alabama St. | SWAC | 0.05 | 0.05 | 25.81 | 25.81 | -0.02 | -0.02 |
| Alcorn St. | SWAC | 0.05 | 0.05 | 25.00 | 25.00 | -0.03 | -0.03 |
| Grambling St. | SWAC | 0.05 | 0.05 | 53.33 | 53.33 | 0.00 | 0.00 |
| Jackson St. | SWAC | 0.05 | 0.05 | 33.33 | 33.33 | -0.02 | -0.02 |
| Prairie View A&M | SWAC | 0.05 | 0.05 | 45.45 | 45.45 | -0.00 | -0.00 |
| Kentucky | SEC | 0.03 | 0.03 | 70.59 | 70.59 | 0.01 | 0.01 |
| Nicholls St. | Slnd | 0.03 | 0.03 | 60.71 | 60.71 | 0.01 | 0.01 |
| Western Michigan | MAC | 0.03 | 0.03 | 50.00 | 50.00 | 0.00 | 0.00 |
| Arkansas | SEC | 0.03 | 0.03 | 67.65 | 67.65 | 0.01 | 0.01 |
| Binghamton | AE | 0.03 | 0.03 | 31.03 | 31.03 | -0.01 | -0.01 |
| Louisiana Tech | CUSA | 0.03 | 0.03 | 48.39 | 48.39 | -0.00 | -0.00 |
| Milwaukee | Horz | 0.03 | 0.03 | 48.39 | 48.39 | -0.00 | -0.00 |
| Appalachian St. | SB | 0.03 | 0.03 | 41.94 | 41.94 | -0.00 | -0.00 |
| Belmont | OVC | 0.03 | 0.03 | 72.73 | 72.73 | 0.01 | 0.01 |
| Charlotte | CUSA | 0.03 | 0.03 | 17.86 | 17.86 | -0.02 | -0.02 |
| FIU | CUSA | 0.03 | 0.03 | 37.93 | 37.93 | -0.01 | -0.01 |
| Florida | SEC | 0.03 | 0.03 | 62.50 | 62.50 | 0.01 | 0.01 |
| Oklahoma St. | B12 | 0.03 | 0.03 | 57.58 | 57.58 | 0.00 | 0.00 |
| Old Dominion | CUSA | 0.03 | 0.03 | 78.12 | 78.12 | 0.02 | 0.02 |
| Penn St. | B10 | 0.03 | 0.03 | 61.76 | 61.76 | 0.01 | 0.01 |
| Pittsburgh | ACC | 0.03 | 0.03 | 25.00 | 25.00 | -0.01 | -0.01 |
| Radford | BSth | 0.03 | 0.03 | 62.50 | 62.50 | 0.01 | 0.01 |
| Richmond | A10 | 0.03 | 0.03 | 37.50 | 37.50 | -0.01 | -0.01 |
| Texas A&M | SEC | 0.03 | 0.03 | 62.50 | 62.50 | 0.01 | 0.01 |
| The Citadel | SC | 0.03 | 0.03 | 27.59 | 27.59 | -0.01 | -0.01 |
| Eastern Illinois | OVC | 0.03 | 0.03 | 34.48 | 34.48 | -0.01 | -0.01 |
| Eastern Kentucky | OVC | 0.03 | 0.03 | 31.03 | 31.03 | -0.01 | -0.01 |
| Georgia Southern | SB | 0.03 | 0.03 | 61.29 | 61.29 | 0.01 | 0.01 |
| IUPUI | Horz | 0.03 | 0.03 | 32.14 | 32.14 | -0.01 | -0.01 |
| Little Rock | SB | 0.03 | 0.03 | 20.00 | 20.00 | -0.02 | -0.02 |
| Mississippi | SEC | 0.03 | 0.03 | 37.50 | 37.50 | -0.01 | -0.01 |
| Vermont | AE | 0.03 | 0.03 | 78.79 | 78.79 | 0.02 | 0.02 |
| Albany | AE | 0.03 | 0.03 | 67.74 | 67.74 | 0.01 | 0.01 |
| Coastal Carolina | SB | 0.03 | 0.03 | 37.93 | 37.93 | -0.01 | -0.01 |
| Fairleigh Dickinson | NEC | 0.03 | 0.03 | 37.93 | 37.93 | -0.01 | -0.01 |
| Holy Cross | Pat | 0.03 | 0.03 | 38.71 | 38.71 | -0.01 | -0.01 |
| Marist | MAAC | 0.03 | 0.03 | 19.35 | 19.35 | -0.02 | -0.02 |
| New Hampshire | AE | 0.03 | 0.03 | 27.59 | 27.59 | -0.01 | -0.01 |
| NJIT | ASun | 0.03 | 0.03 | 42.86 | 42.86 | -0.00 | -0.00 |
| Ohio | MAC | 0.03 | 0.03 | 43.33 | 43.33 | -0.00 | -0.00 |
| Quinnipiac | MAAC | 0.03 | 0.03 | 36.36 | 36.36 | -0.01 | -0.01 |
| Rhode Island | A10 | 0.03 | 0.03 | 78.12 | 78.12 | 0.02 | 0.02 |
| St. John's | BE | 0.03 | 0.03 | 46.88 | 46.88 | -0.00 | -0.00 |
| Syracuse | ACC | 0.03 | 0.03 | 60.61 | 60.61 | 0.01 | 0.01 |
| Yale | Ivy | 0.03 | 0.03 | 50.00 | 50.00 | 0.00 | 0.00 |
| Alabama | SEC | 0.03 | 0.03 | 55.88 | 55.88 | 0.00 | 0.00 |
| Massachusetts | A10 | 0.03 | 0.03 | 39.39 | 39.39 | -0.01 | -0.01 |
| Princeton | Ivy | 0.03 | 0.03 | 42.86 | 42.86 | -0.00 | -0.00 |
| UT Arlington | SB | 0.03 | 0.03 | 60.61 | 60.61 | 0.01 | 0.01 |
| Cincinnati | Amer | 0.03 | 0.03 | 88.24 | 88.24 | 0.02 | 0.02 |
| SMU | Amer | 0.03 | 0.03 | 51.52 | 51.52 | 0.00 | 0.00 |
| Tennessee Martin | OVC | 0.03 | 0.03 | 27.59 | 27.59 | -0.01 | -0.01 |
| Texas St. | SB | 0.03 | 0.03 | 41.94 | 41.94 | -0.00 | -0.00 |